To read your website traffic report, look past total visits and focus on three numbers: key events (real inquiries) per month, organic search visits over time, and which channels bring visitors who actually act.
Your traffic report comes from Google Analytics 4 (GA4), Google’s free analytics tool. It shows how many people visit your site, where they come from and what they do once they arrive. Most of it is useful context; a few numbers tell you whether the site is doing its job.
Key Takeaways
- Users are people, sessions are visits, and key events are the actions that matter, such as forms and calls.
- Organic search is the traffic SEO grows; paid search stops when the ad budget does.
- A drop in visits with steady key events is usually not a problem.
- Your form inbox is the true lead count; GA4 shows the trend.
The numbers on the report
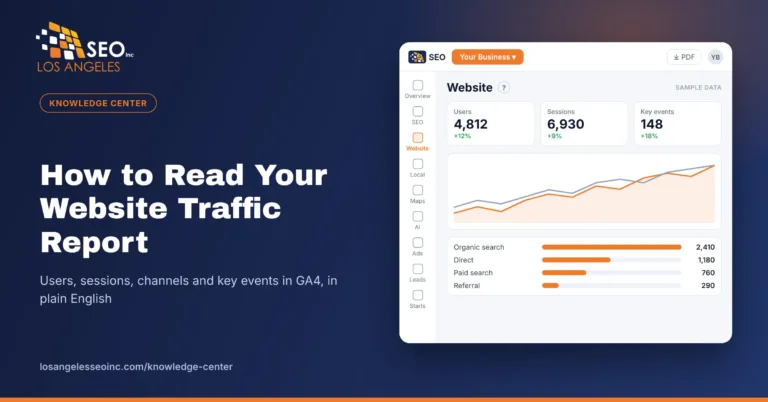
- Users: how many different people visited. One person on a phone and a laptop can count twice, so treat it as a close estimate.
- Sessions: visits. One user can have several sessions in a month.
- Engagement rate: the share of sessions where someone stayed at least 10 seconds, viewed two or more pages, or completed a key event. Higher means visitors find what they came for.
- Key events: the actions that matter to your business, such as a form sent, a call button tapped or an application started. GA4 used to call these conversions.
Where visitors come from
GA4 groups visits into channels:
- Organic search: people who clicked your site in Google or Bing’s regular results. This is the traffic SEO grows.
- Paid search: clicks on your Google Ads.
- Direct: people who typed your address, used a bookmark, or came from a source Google can’t identify, such as some apps and AI tools.
- Referral: clicks from other websites that link to you.
- Social: visits from Facebook, Instagram, LinkedIn and similar platforms.
A healthy site rarely depends on one channel. If paid search brings most of your visitors, your traffic stops the day the ad budget does.
The three numbers to watch
- Key events per month, because they are real inquiries, not just visits.
- Organic search visits over time, because they show whether your SEO is building lasting traffic.
- Key event rate by channel, because it shows which sources bring visitors who act, not just visitors.
How we report website traffic for clients
In our client reporting portal, the Website tab shows these numbers for the date range you pick, compared with the previous period, in plain language. Want to know which channels bring your best customers? Ask our team for a free review of your analytics.
Frequently asked questions
Why did my website traffic drop?
Check the date range and the comparison period first. Seasonality, a paused ad campaign, a Google update or a site change can all move traffic. A drop in visits with steady key events is usually not a problem.
Why don’t GA4 numbers match my form inbox?
GA4 doesn’t count visitors who block tracking, and a form can be sent more than once. Your inbox is the true count; GA4 shows the trend.
What is a good engagement rate?
It varies by industry and page type. Compare your own rate over time and between channels rather than chasing a single benchmark.