- Real Growth. Proven SEO. Trusted Results.

Client Reporting Portal: Your SEO, Maps, Ads and AI Results in One Place
The Los Angeles SEO Inc client portal is a live reporting dashboard where every client sees how their marketing is performing: Google Search, website visits and leads, Google Business Profile, Google Maps rankings, Google Ads, reviews, website health and whether AI assistants like ChatGPT recommend their business. It was built by our in-house team and is included for our clients.
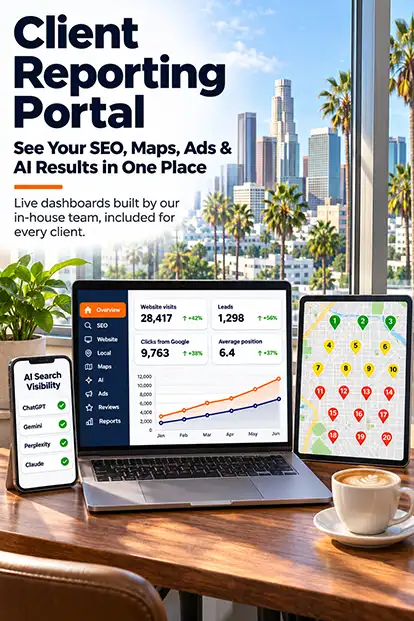
WHY WE BUILT IT
You Should Never Wonder What Your Marketing Is Doing
Most business owners get a long PDF once a month and still cannot tell whether their marketing is working. Our portal answers the questions owners actually ask: Am I showing up on Google? Are people calling? Where do I rank on the map? Is ChatGPT recommending me? Is my ad budget bringing in leads? Every number is explained in plain English, and you can log in any time.
Plain-English Numbers
Every metric has a short explanation, so you know what it means and why it matters.
Live, Connected Data
Data comes from your own Google, HubSpot and email accounts and refreshes automatically.
One Login for Everything
Search, Maps, ads, reviews, AI visibility and monthly reports in one place.
Each client sees only their own business, and client data is never shared or published. Data comes from the accounts you connect, such as Google Search Console, Google Analytics, Google Business Profile, Google Ads, HubSpot and Constant Contact. Your account team uses the same dashboard, so we look at the same numbers in every review call. Screenshots on this page use demo data.
WHAT'S INSIDE
Everything Your Dashboard Shows
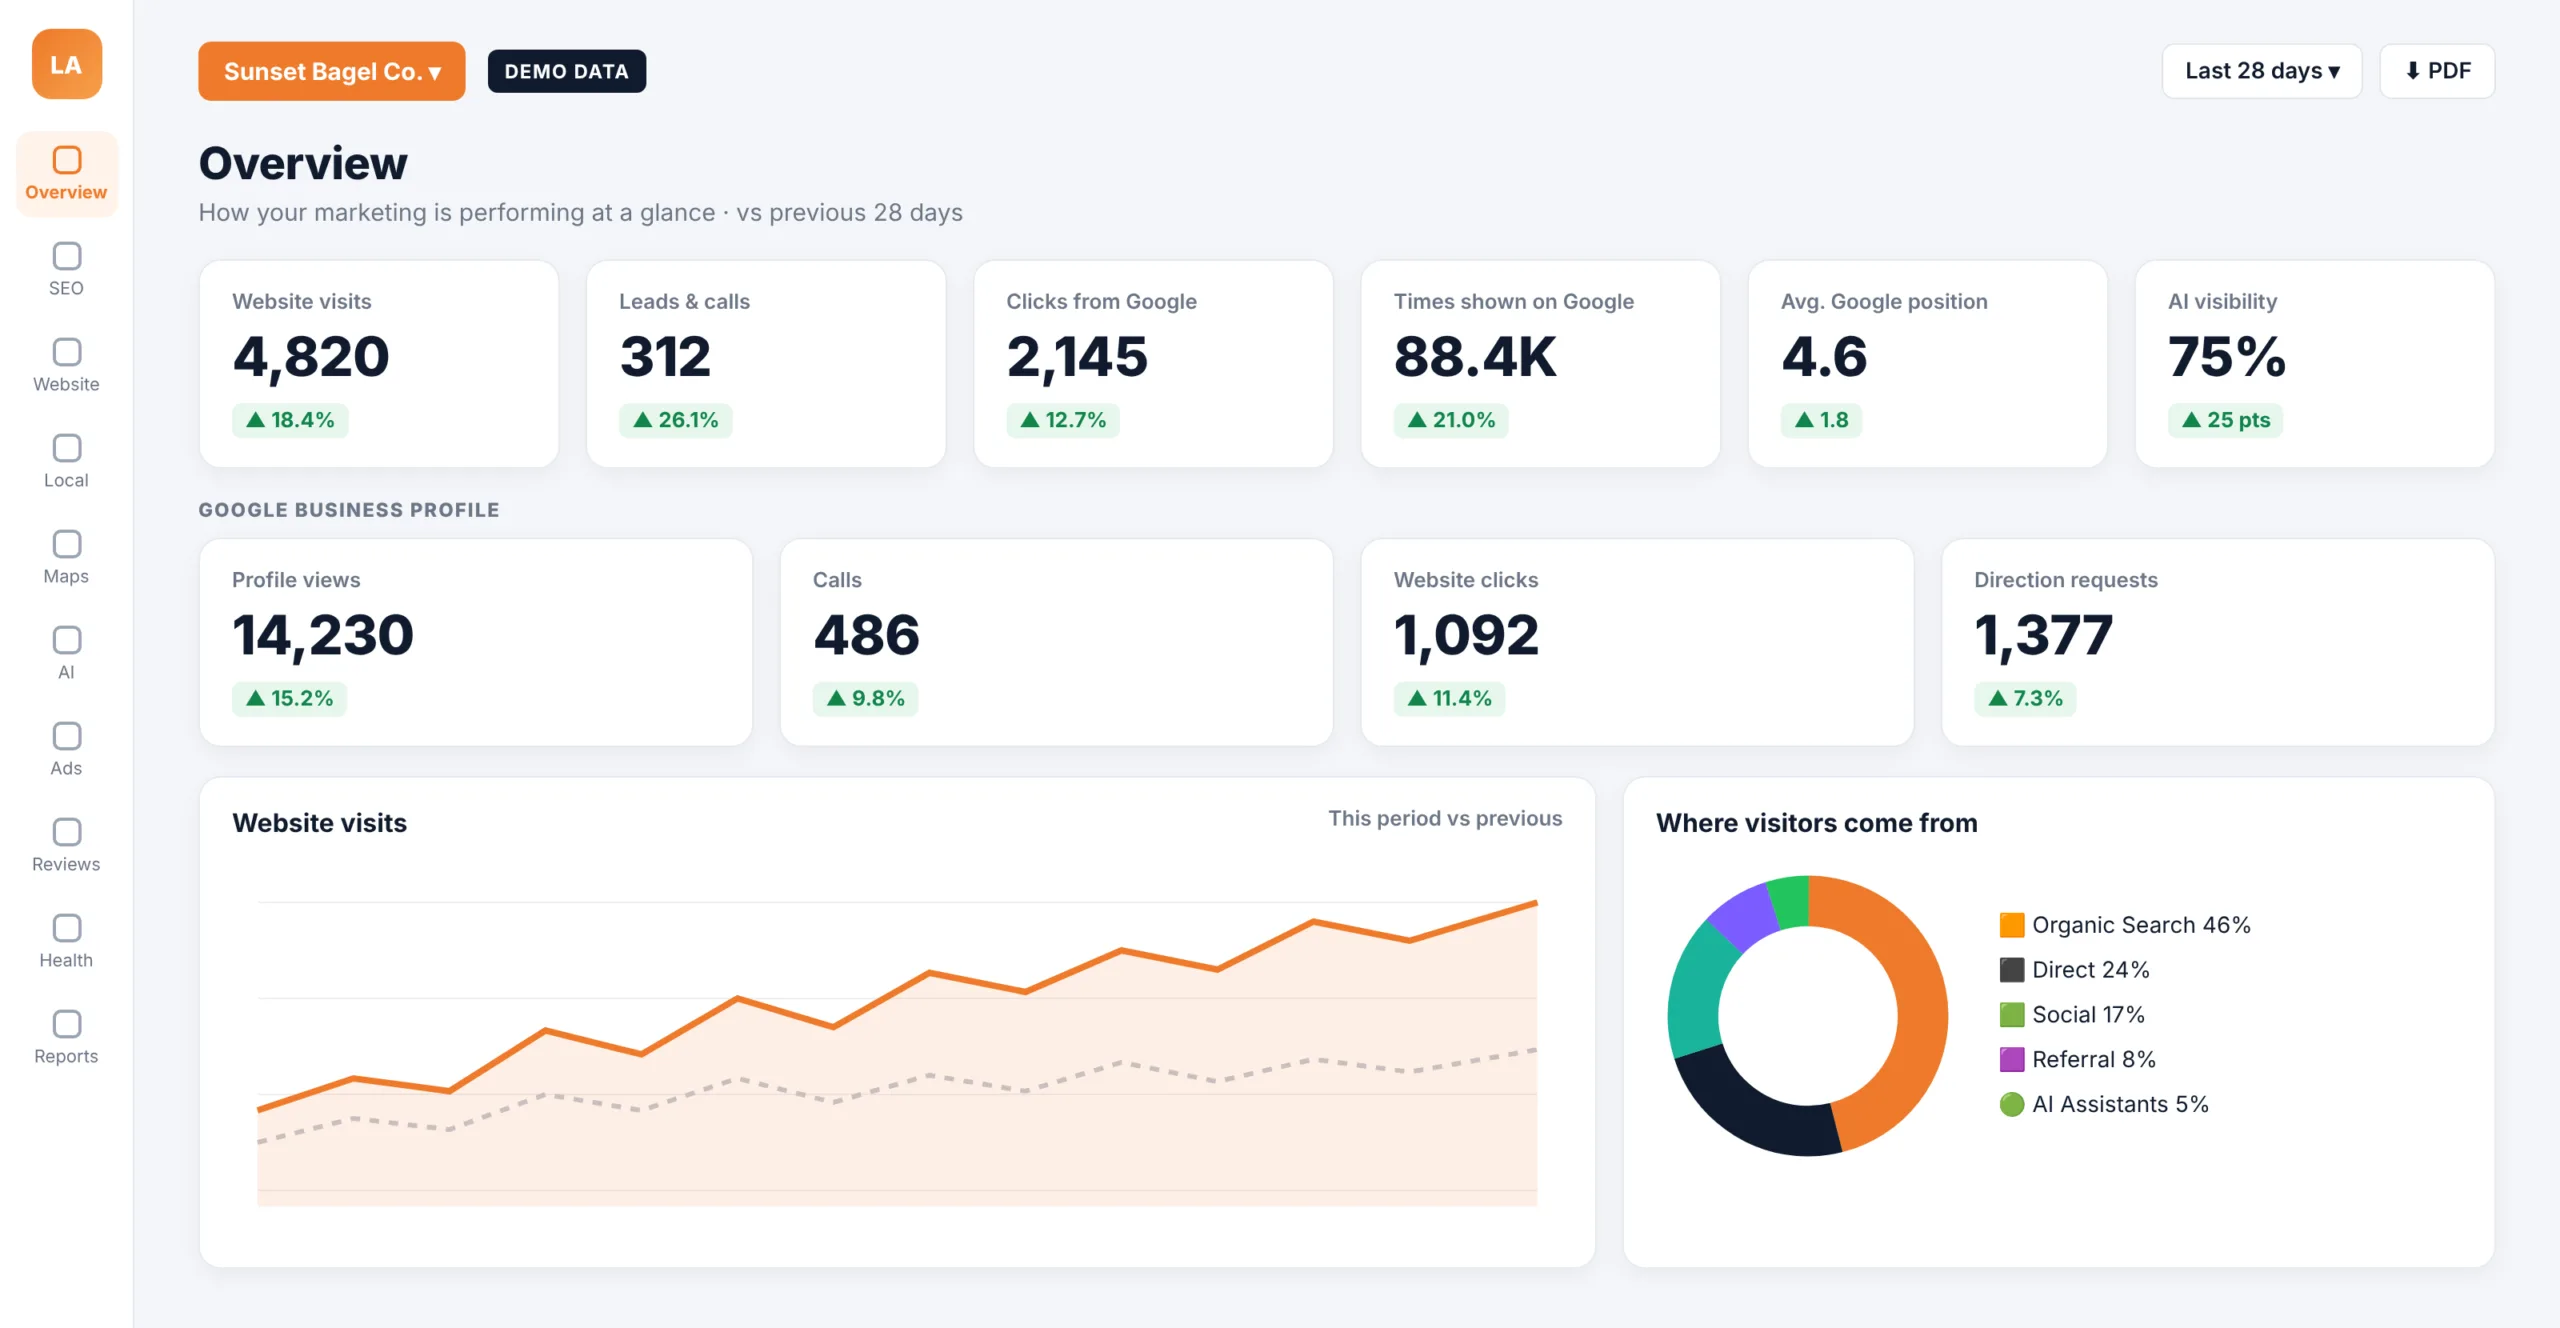
Each section of the portal answers one question about your marketing, with a comparison to the previous period.
Overview
Website visits, leads, Google clicks, Business Profile actions and ad results at a glance.
Google Search (SEO)
The searches you appear for, clicks, impressions, average position and your best pages.
Website (Google Analytics)
Sessions, visitors, engagement, traffic sources and top landing pages.
Google Business Profile
Profile views, calls, direction requests and website clicks from your listing.
Google Maps Rankings
A rank grid that shows where you appear on Google Maps across your service area.
AI Search Visibility
Whether ChatGPT, Gemini, Perplexity and Claude mention or cite your business.
MAPS RANK GRID
See Exactly Where You Rank on Google Maps
The portal runs Google Maps searches such as “bagel shop” or “dentist near me” from a 5 × 5 grid of points across your service area. Each pin shows your rank from that spot, so you can see exactly where you win the map and where competitors take the top three. The example shown uses demo data for a sample restaurant.
Restaurant clients like Beverly Hills Bagel use this view to see how their visibility changes neighborhood by neighborhood. Client data is private and is never shown on our website.
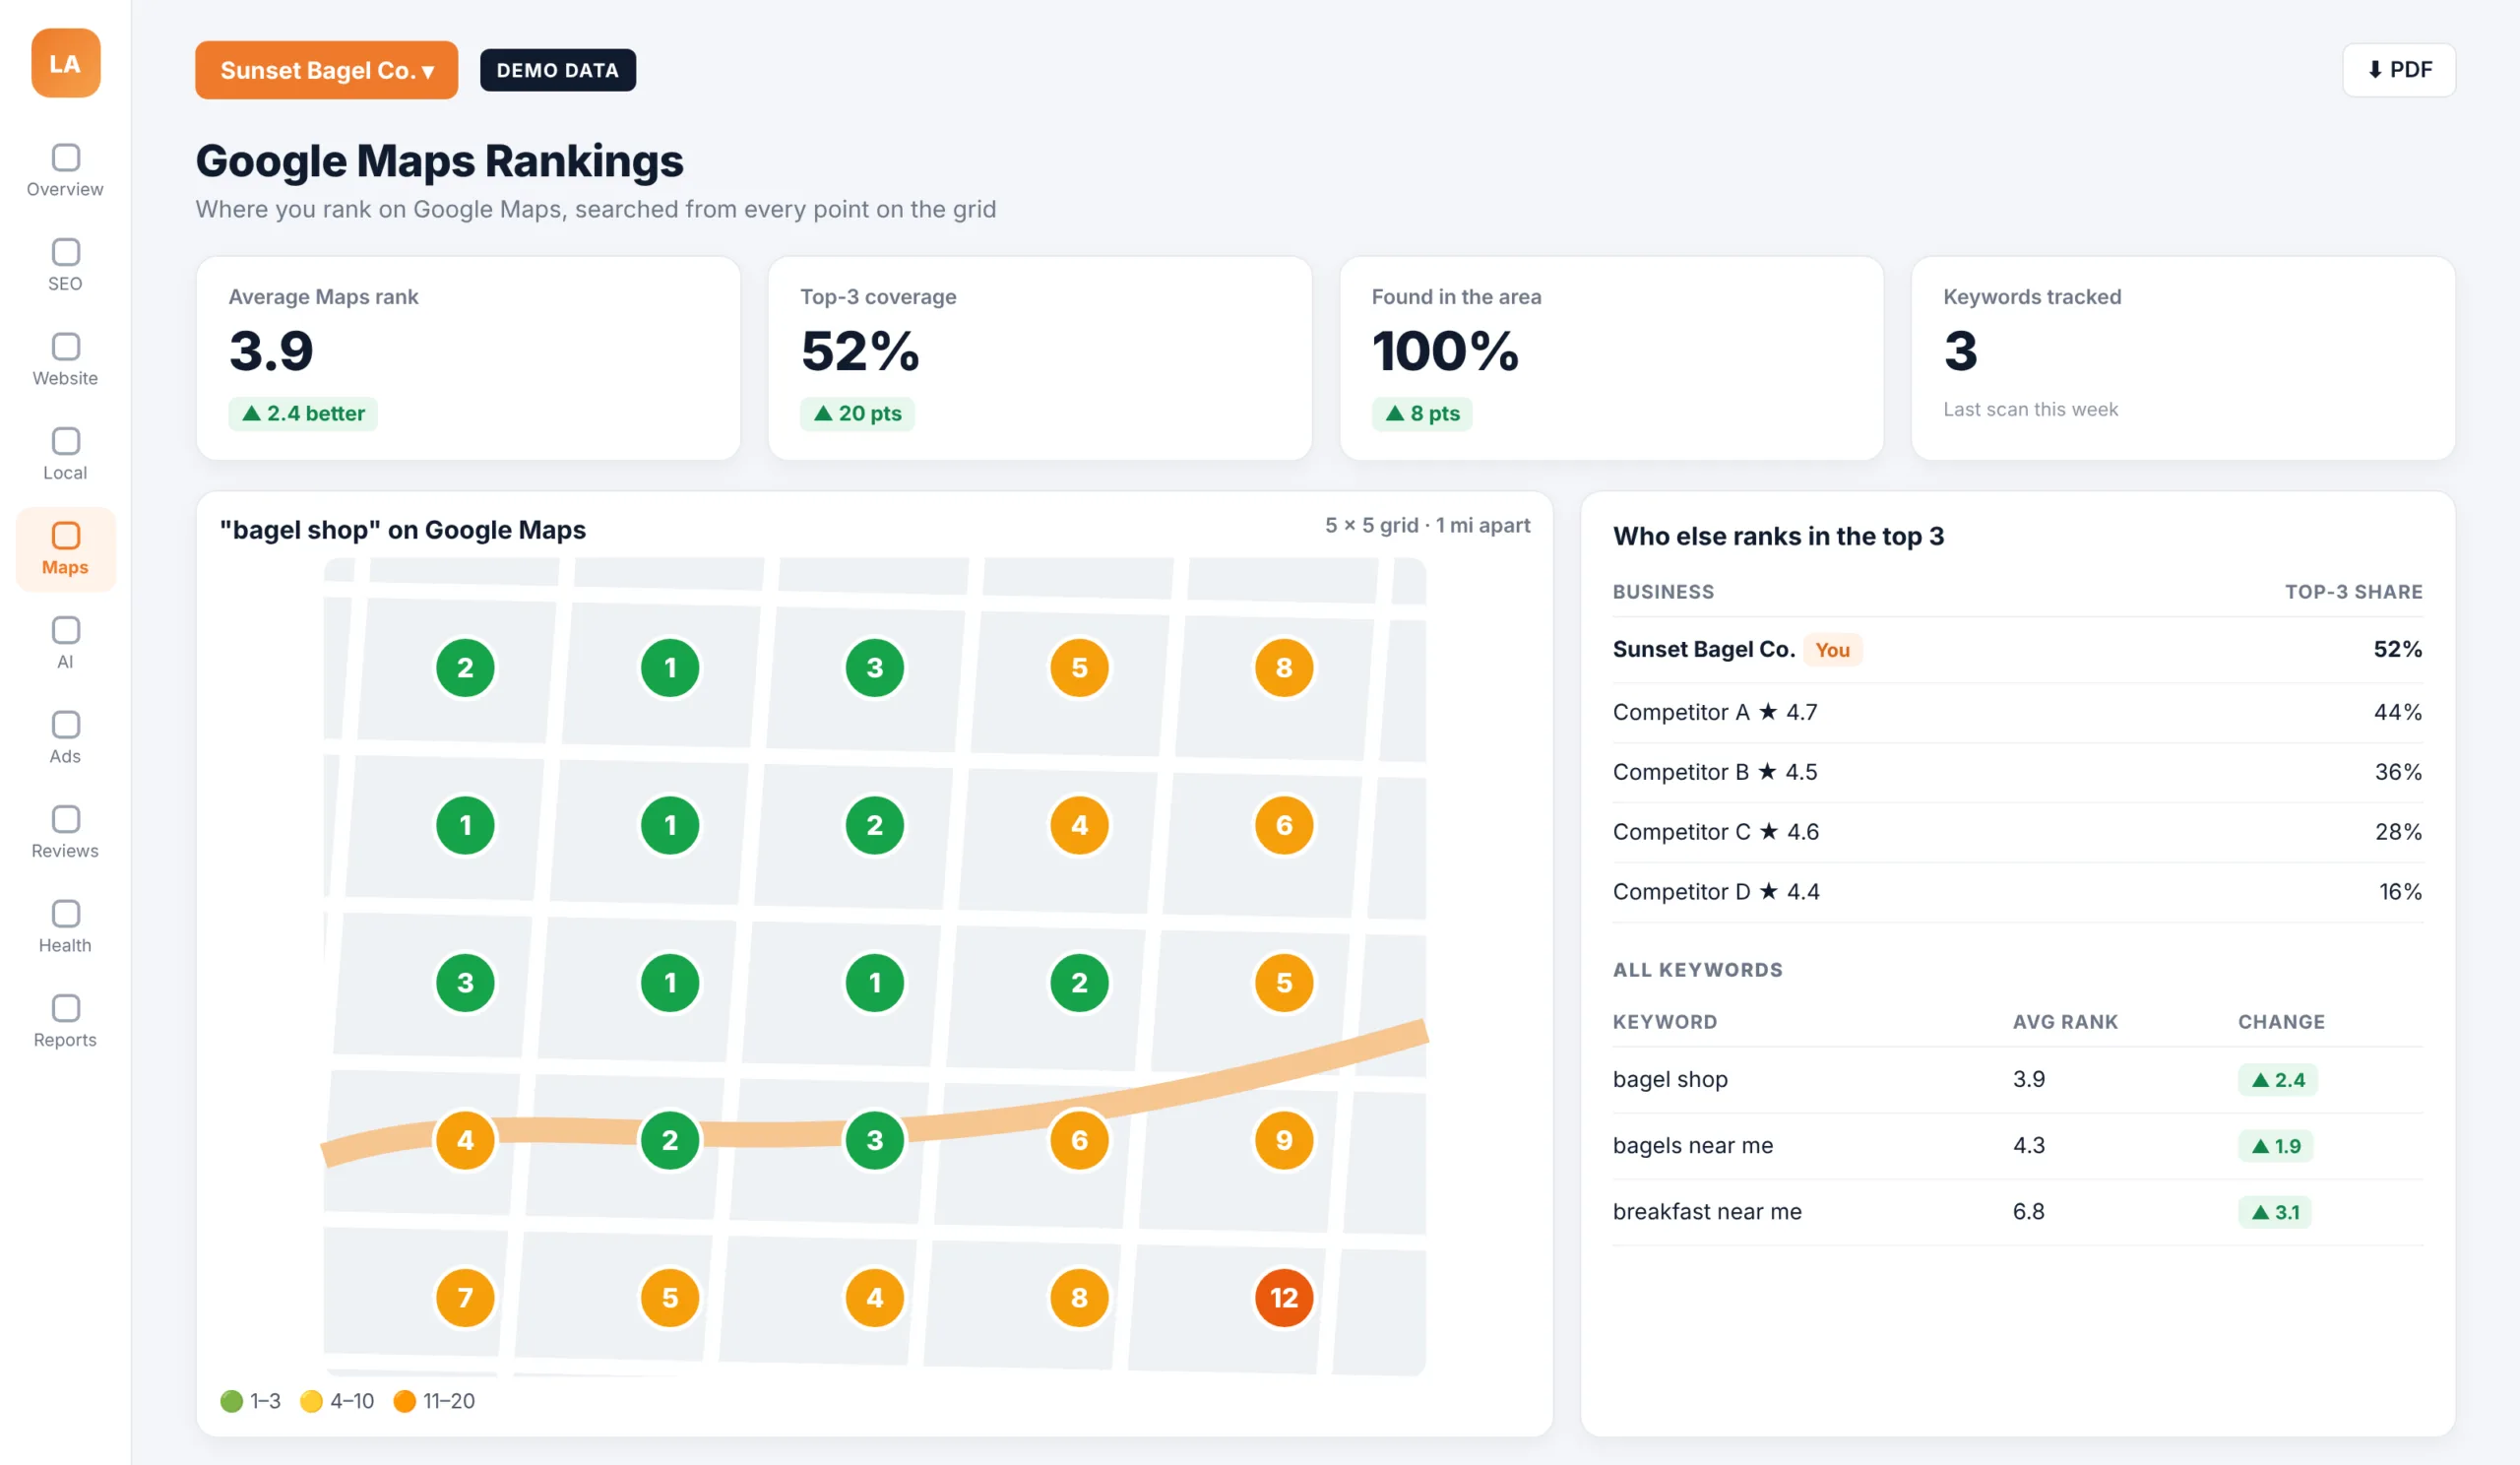
Google Maps Rank Grid
Google Maps rankings change from street to street. A single ranking number hides that, so the portal shows the full picture across your area.
Grid Scans
Searches run from many points across your area, not just one location.
Top-3 Competitors
See who else ranks in the top three and how often.
Keyword Tracking
Average rank, top-3 coverage and visibility for each keyword over time.
More Reports in Your Portal
Beyond search and maps, the portal brings your other marketing channels into the same view.
Google Ads
Ad spend, clicks, leads and cost per lead, compared with the previous period.
Reviews
Your rating over time, new reviews and reviews still waiting for a reply.
Website Health
Uptime, security certificate status and phone page speed, with alerts if your site goes down.
Email Marketing
Opens, clicks and list growth from your Constant Contact campaigns.
Leads & Conversions
Form submissions and leads from your connected HubSpot account.
Top Searches & Pages
What people typed to find you and the first page they landed on.
Monthly Reports
Detailed monthly reports built in Google Looker Studio, available inside the portal.
PDF Download
Download any dashboard as a PDF to share with your team or partners.
AI SEARCH VISIBILITY
See Whether ChatGPT, Gemini, Perplexity and Claude Recommend You
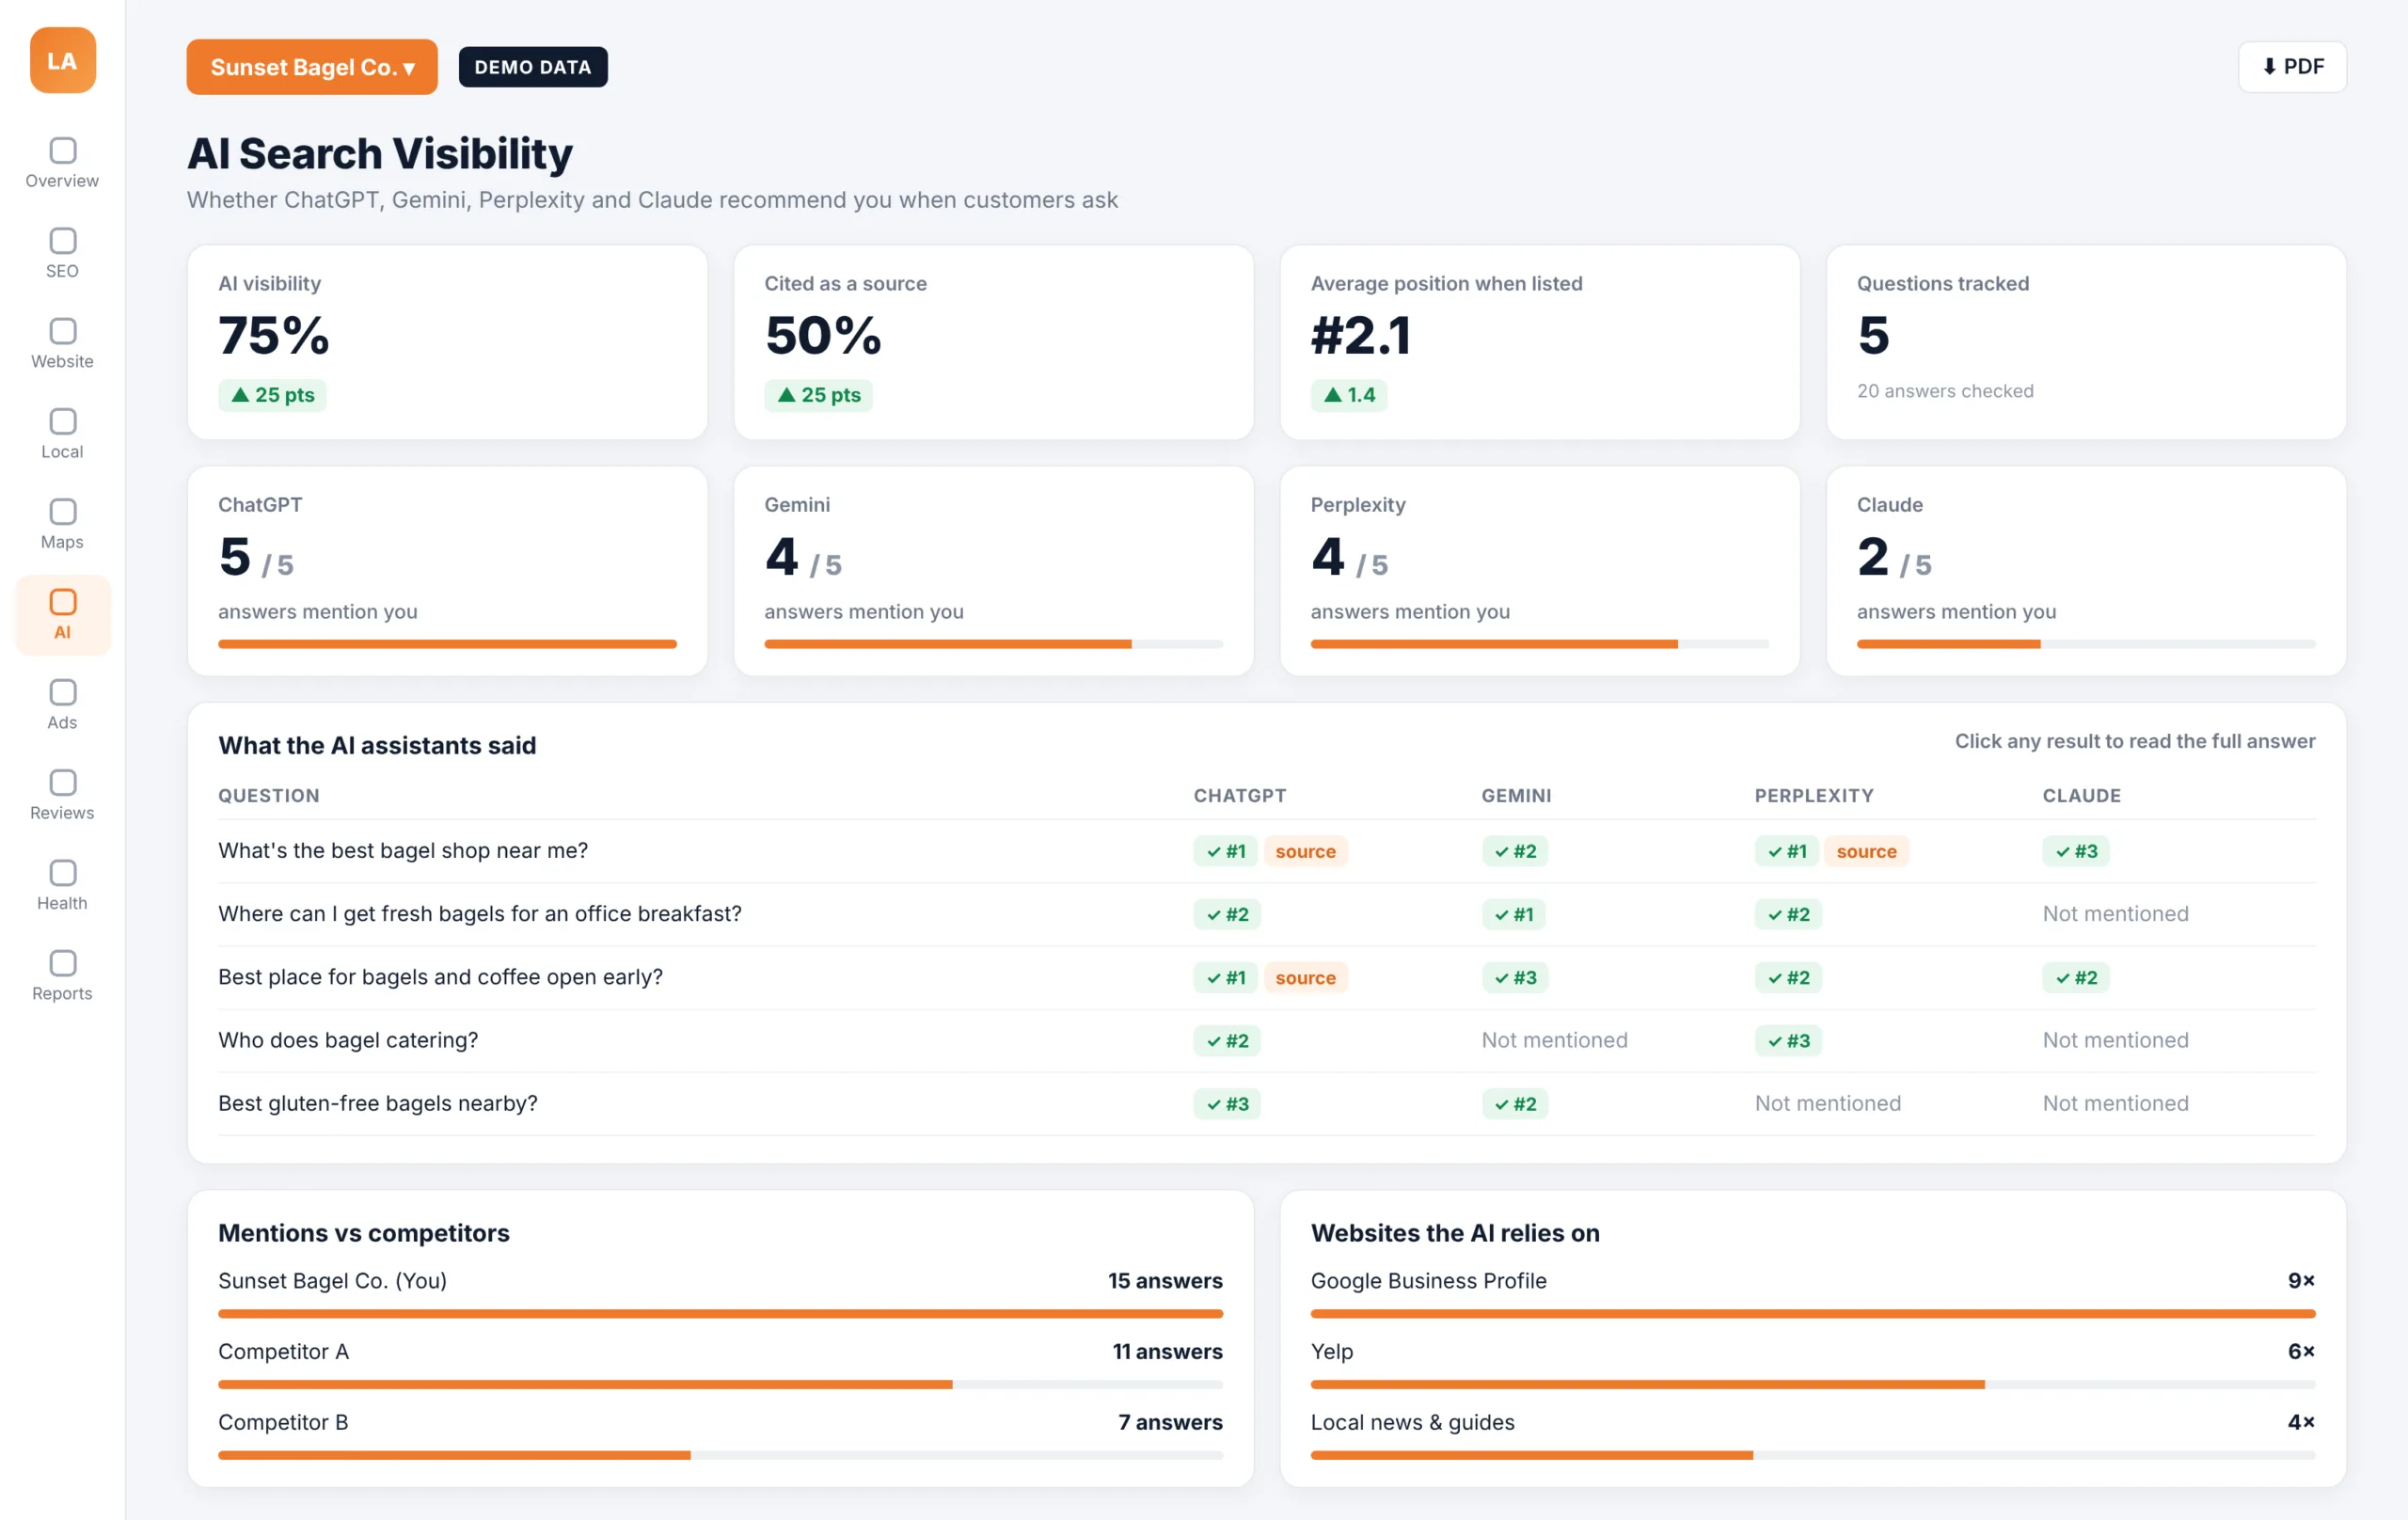
More customers now ask AI assistants which business to choose. The portal asks the questions your customers ask and records whether each assistant mentions your business, where it ranks you and whether it cites your website, so you can see your AI visibility grow over time.
It also shows which websites the AI assistants rely on as sources, so we know which listings and publications to strengthen next.
LIVE REPORTS
Monthly Reports Built in Google Looker Studio
Every month your account team prepares a detailed report in Google Looker Studio, covering Google Analytics and Google Search Console data such as sessions, active users, engagement, traffic sources and landing pages. The reports are live, so you can change the date range and see current numbers instead of a static file.
EDUCATION EXAMPLE
Education Example: SOCHI
For education clients like the Southern California Health Institute (SOCHI), the portal connects search visibility, Google Ads and program pages with what matters most to a school: inquiries, tour requests and applications.
Admissions and marketing teams see the same numbers, so decisions about programs and budgets are based on real data.
What Schools Track in the Portal
- Visits and leads by program page
- Searches students use to find the school
- Google Ads leads and cost per lead
- Google Business Profile calls and directions
- Top landing pages and traffic sources
- Monthly Looker Studio reports
WHAT YOU CAN TRACK
Key Metrics in Plain English
Each number in the portal comes with a short explanation and a comparison with the previous period, so you can see at a glance what improved and what needs attention.
Website Visits
How many people visited your website in the period.
Leads & Conversions
Calls, forms and other actions that can turn into customers.
Clicks From Google
How many people clicked through to your site from Google Search.
Average Google Position
Where your pages appear in Google results on average.
Profile Views & Calls
How often your Google Business Profile is seen and called.
Average Maps Rank
Your average position on Google Maps across your area.
AI Visibility
How often AI assistants mention your business for tracked questions.
Cost per Lead
What each lead from Google Ads costs, so you can judge your ad budget.
GETTING STARTED
How Onboarding Works
Connect Your Accounts
We connect your Google Search Console, Google Analytics, Business Profile, Ads and other tools.
Choose Keywords & Areas
We set the searches, map areas and AI questions that matter to your business.
Run the First Scans
Maps, AI visibility and website health scans create your starting point.
Review Your Baseline
We walk you through your dashboard and agree on goals.
Monthly Reports
Each month your report is ready in the portal, with live data.
Ongoing Reviews
We use the same dashboard in every review call to choose the next priorities.
BUILT IN-HOUSE
Built by Our Own Team in Los Angeles
The portal was designed and developed in-house by Los Angeles SEO Inc, led by our founder, Sasan Raeisi, who brings more than 37 years of IT experience. Because we built it ourselves, we keep adding the reports our clients ask for.
MULTIPLE BUSINESSES
One Login for Every Business You Own
Owners with more than one business or location can switch between them from the same login, with separate data and reports for each.
WHY IT MATTERS
Transparency You Can Check Any Time
We believe clients should see the same data we see. The portal shows your real results from your own accounts, good months and slow months alike, so every conversation with your account team starts from facts.
The portal is included for our SEO, local SEO, Google Ads and website clients. Already a client? Log in to your dashboard. Not yet? Get a free strategy session and we will show you what your dashboard would track.
REAL QUESTIONS
Reports That Answer Real Business Questions
Every section of the portal is built around a question business owners ask us.
Am I Showing Up?
Google Search impressions, positions and Maps rankings.
Are People Calling?
Calls, direction requests and website clicks from your Google profile.
Is AI Recommending Me?
Mentions and citations in ChatGPT, Gemini, Perplexity and Claude.
Is My Ad Budget Working?
Google Ads leads and cost per lead.
Frequently Asked Questions
Common questions about our client reporting portal.
What is the Los Angeles SEO Inc client portal?
It is a live reporting dashboard where our clients see their Google Search, website, Google Business Profile, Google Maps rankings, Google Ads, reviews, website health, email marketing and AI search visibility results in one place.
Is the portal included with your services?
Yes. The portal is included for our SEO, local SEO, Google Ads and website clients. The sections you see depend on the services and accounts connected for your business.
Which accounts does the portal connect to?
The portal uses data from accounts you connect, such as Google Search Console, Google Analytics, Google Business Profile, Google Ads, HubSpot and Constant Contact.
How often is the data updated?
Connected data refreshes automatically, and you can refresh it yourself at any time. Maps rank grid and AI visibility scans run on a regular schedule, and the date of the last scan is shown on each report.
Can I see whether ChatGPT recommends my business?
Yes. The AI search visibility report checks questions your customers ask in ChatGPT, Gemini, Perplexity and Claude, and shows whether each assistant mentions your business, where it ranks you and whether it cites your website.
What is a Google Maps rank grid?
A rank grid runs the same Google Maps search from many points across your area and shows your rank at each point. It shows where you win the map, where competitors do, and how your coverage changes over time.
Do I still get monthly reports?
Yes. Your account team prepares detailed monthly reports in Google Looker Studio, available inside the portal, and you can download any dashboard as a PDF.
Can I manage more than one business or location?
Yes. Owners with several businesses or locations can switch between them from one login, with separate data for each.
How do I log in?
Clients log in at reports.laseoinc.com. If you need access for a team member, contact your account manager.